


Are you facing the “AttributeError: ‘dict’ object has no attribute ‘plot’” error in Python while visualizing the data?
Python is a versatile programming language used for data analysis and visualization. It has tons of built-in libraries and frameworks used to solve complex problems, whether they are related to web development, artificial intelligence, or data science.
In this article, we’ll discuss what is the “AttributeError: ‘dict’ object has no attribute ‘plot’” error in Python, why it occurs along with practical examples.
For more information about what is an AttributeError, and the general fixes to tackle the error, you may refer to our other guide here.
Let’s get right into the topic 👇
Table of Contents
What is the “AttributeError: ‘Dict’ Object Has No Attribute ‘Plot’” Error?
The “AttributeError: ‘dict’ object has no attribute ‘plot’” error occurs in Python when the dictionary object cannot find the plot attribute. It usually happens when you have not correctly installed the required dependencies into your program.
Code
# create a dictionary

data = {'Year': [2016, 2017, 2018, 2019, 2020, 2021, 2022],

        'student_avg_marks': [76, 81, 83, 82, 73, 75, 80]

       }


data.plot.kde()
Output
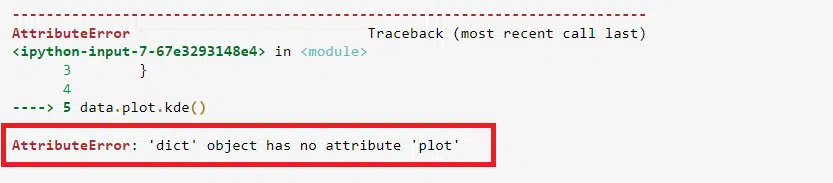
The reason behind this error is that the dictionary object data could not find the plot function because it is missing.
How to Fix the “AttributeError: ‘Dict’ Object Has No Attribute ‘Plot’” Error?
To fix this error, you need to import the required dependencies into your program, but before you straight away import these libraries, make sure they are installed on your local machine. Otherwise, you won’t be able to import them.
To install these libraries, go to your command line interface, and run these commands individually:
To install pandas:
Command
pip install pandas
To install matplotlib:
Command
pip install matplotlib
The above two commands will install pandas and matplotlib; once the installation is completed, you can import them into your current program using the import keyword.
Let’s say we want to visualize the average student’s marks against the year:
Code
# import libraries

import pandas as pd

import matplotlib.pyplot as plt


# create a dictionary

data = {'Year': [2016, 2017, 2018, 2019, 2020, 2021, 2022],

        'student_avg_marks': [76, 81, 84, 82, 73, 75, 80]

       }


# convert the 'data' dictionary into a dataframe

df = pd.DataFrame(data,columns=['Year','student_avg_marks'])


# draw graph from the data frame

df.plot(x ='Year', y='student_avg_marks', kind = 'bar')

plt.show()
Output
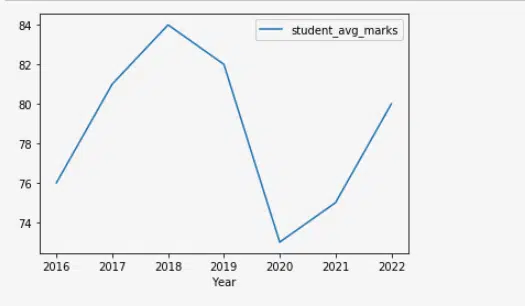
Congrats! We have fixed the error, and now we easy visualize the data in Python. The image is a simple line visualization of the data; we can have other different visualizations like bar charts, dotted lines, pie charts, etc.
This statement df.plot(x =’Year’, y=’student_avg_marks’, kind = ‘bar’) is responsible for the visualizations, you can change the kind = ‘bar’ to other values to see different visualizations.
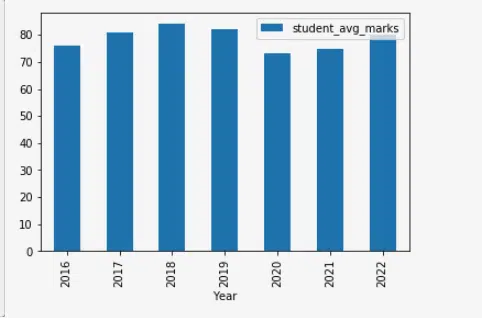
For instance, let’s say we want to see the visualizations in bars:
Code
# import libraries

import pandas as pd

import matplotlib.pyplot as plt


# create a dictionary

data = {'Year': [2016, 2017, 2018, 2019, 2020, 2021, 2022],

        'student_avg_marks': [76, 81, 84, 82, 73, 75, 80]

       }


# convert the 'data' dictionary into a dataframe

df = pd.DataFrame(data,columns=['Year','student_avg_marks'])


# draw graph from the data frame

df.plot(x ='Year', y='student_avg_marks', kind = 'bar')

plt.show()
Output
Conclusion
To summarize this article on how to fix the “AttributeError: ‘dict’ object has no attribute ‘plot’” error, we have discussed what is the “AttributeError: ‘dict’ object has no attribute ‘plot’” error and why it occurs in Python. Furthermore, we have discussed how to install dependencies into your local machines using the pip command and the different charts to visualize data in Python.
For more information about what is an AttributeError, and the general fixes to tackle the error, you may refer to our other guide here.
Let’s have to quick recap of the topics discussed in this article.
- What is the “AttributeError: ‘dict’ object has no attribute ‘plot’” error in Python?
- How do you fix the “AttributeError: ‘dict’ object has no attribute ‘plot’” error in Python?
- How to install libraries in Python using the pip command?
- Different charts to visualize data.
Let’s explore more 🔎; comment down below the different chart kinds to visualize data other than the above.