
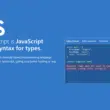


If you want to show, display or plot a graph, figure, or histogram with Python using Matplotlib and Jupyter Notebook, look no further, this is the perfect guide for you!
Matplotlib is an extensive Python library used for data visualization purposes. Matplotlib is a cross-platform and feature-rich library that comes with two APIs (Application Programming Interface), Pyplot, and an Object-Oriented Interface.
Pyplot provides a way of plotting that is similar to MATLAB. Pyplot is used for its interactivity in terms of plot creation and simple cases of generating a plot programmatically. On the other hand, the Object-Oriented Interface is intended for more complex plots.
Matplotlib has many advantages including being beginner-friendly and also easy to use, especially for programmers who have exposure to plotting graphs with other tools. However, Matplotlib also has a disadvantage which is that it is a low-level library compared to other graph plotting tools. Nevertheless, the advantages of Matplotlib outweigh its disadvantages and it is easy to see why it is used by millions of python programmers for plotting and data visualization purposes.
That being said, Matplotlib doesn’t come pre-installed with Python, which means you’ll have to install it yourself. Therefore, in this guide, we will be using Python and Jupyter Notebook to display our plots. So, you need to have Python, PIP, and Jupyter Notebook installed on your system in order to use Matplotlib and start plotting in Jupyter Notebook.
Overall, in this guide, we’ll go over how to install Matplotlib in Windows, Linux, and macOS, and how you can start coding with it in Jupyter Notebook.
Table of Contents
Installing Matplotlib on Windows
If you would like to install Matplotlib on a Windows machine:
- First, verify if python is installed on your system by opening the Command Prompt and entering python –version.
If python is installed on your system, the version will be displayed. Else, if you don’t have python installed, you can install it from here.
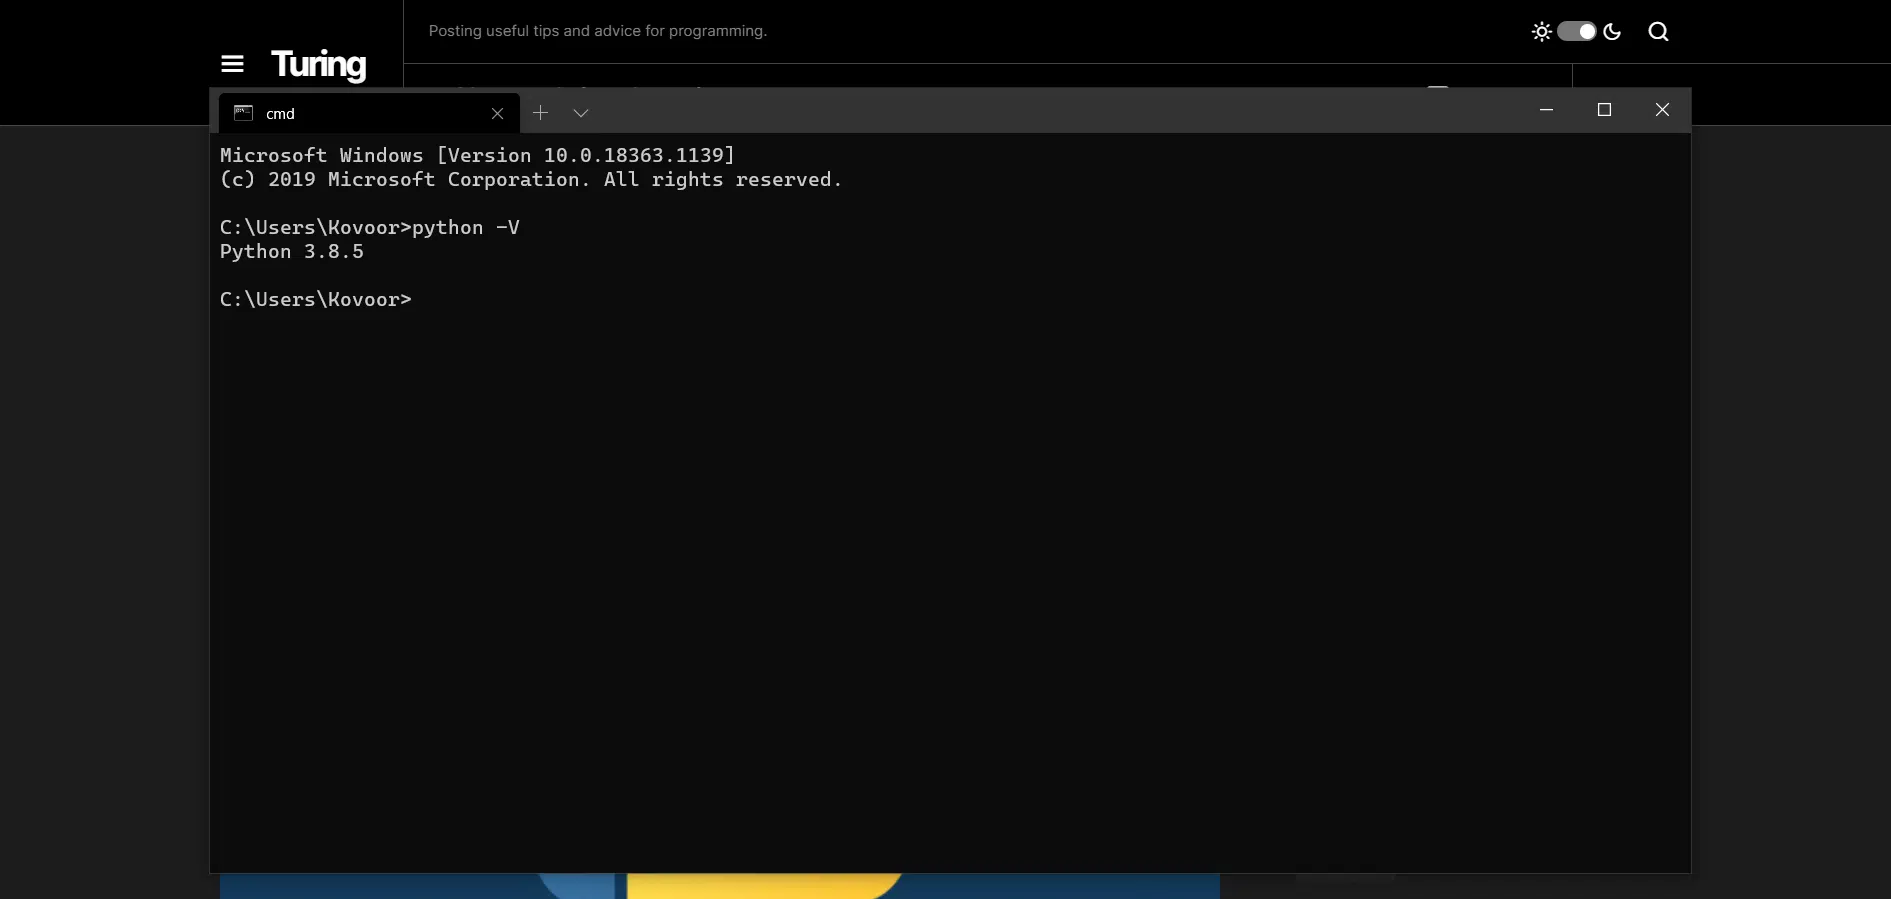
- Next, verify if pip is installed on your system as we will be using pip to install Matplotlib. So, enter pip -V or pip help in the command line.
Again, if pip is installed, the version will be displayed. Else if you don’t have pip installed, you can learn how to install it in our guide here.
- Thirdly, install Matplotlib by entering pip install matplotlib in the command line.
pip install matplotlib
Once Matplotlib has been installed, you will receive a confirmation message that looks like the following:
![]()
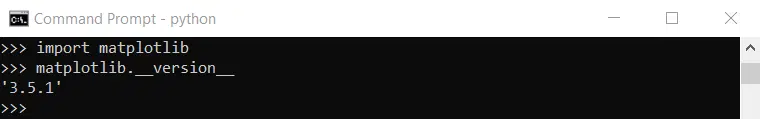
- Lastly, enter import matplotlib in the Python Terminal once Matplotlib has been installed to verify if it works. There should be no error message shown once imported. You can also enter matplotlib.__version__ after importing, to check if it was installed correctly. If all went well, the result should show the current version of matplotlib you have just installed.
Installing Matplotlib on Linux
If you would like to install Matplotlib on a Linux machine:
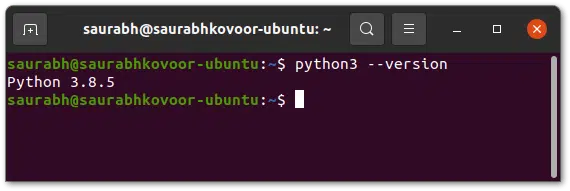
- First, verify if python is installed on your system by opening the Linux Terminal and entering python3 –version.
If python is installed on your system, the version will be displayed. Else, if you don’t have python installed, you can install it from here.
- Second, assuming you are using a Debian-based distribution of Linux, install Matplotlib by entering sudo apt-get install python3-matplotlib in the Linux Terminal.
sudo apt-get install python3-matplotlib
- Then, enter your password if prompted and enter “y” to confirm the installation.
- Lastly, enter import matplotlib in the Python Terminal once Matplotlib has been installed to verify if it works. There should be no error message shown once imported.
import matplotlib
Installing Matplotlib on macOS
If you would like to install Matplotlib on a macOS machine:
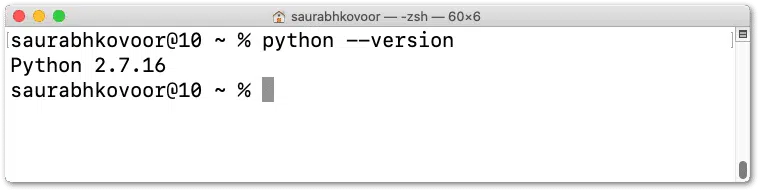
- First, verify if python is installed on your system by opening the Terminal and entering python3 –version.
If python is installed on your system, the version will be displayed. Else, if you don’t have python installed, you can install it from here.
- Second, verify if pip is installed on your system as we will be using pip to install Matplotlib. So, enter pip3 –version or pip help in the Terminal.
If pip is installed, the version will be displayed. Else, if you don’t have pip installed, learn how to do it here.
- Third, install Matplotlib by entering pip install matplotlib in the Terminal. You will receive a confirmation message that looks similar to the one listed in the Windows section once Matplotlib has been installed.
pip install matplotlib
- Lastly, enter import matplotlib in the Python Terminal once Matplotlib has been installed to verify if it works. There should be no error message shown once imported.
import matplotlib
Using Matplotlib to Show Plot With Python in Jupyter Notebook
In order to display a plot in Python, we will be using Matplotlib in Jupyter Notebook. This example will be shown using Windows.
- First, install Jupyter Notebook by opening the Command Prompt or Terminal and entering:
pip install notebook
Once it has been installed, the following result should be displayed:
![]()
- Second, run Jupyter notebook by entering jupyter notebook in the prompt.
jupyter notebook
- A tab should be opened in your web browser that looks like this:
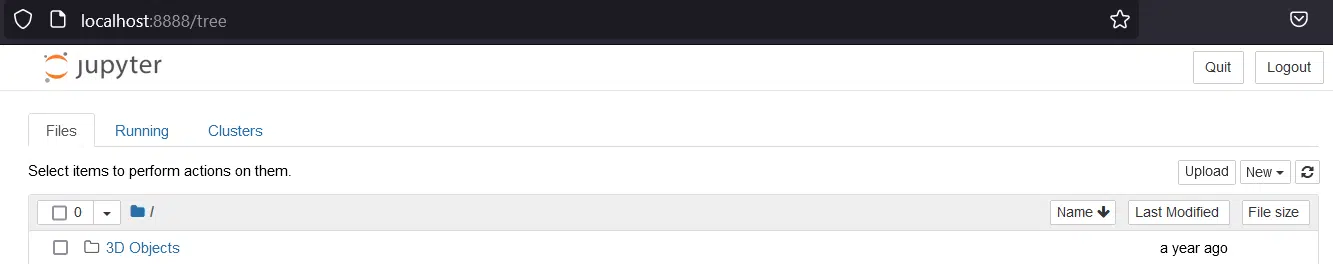
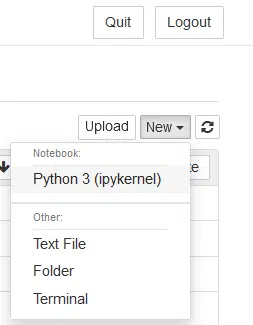
- In the top-right corner, click New and then select Python 3 (ipykernel) from the drop-down.
- Then, another tab should be opened.
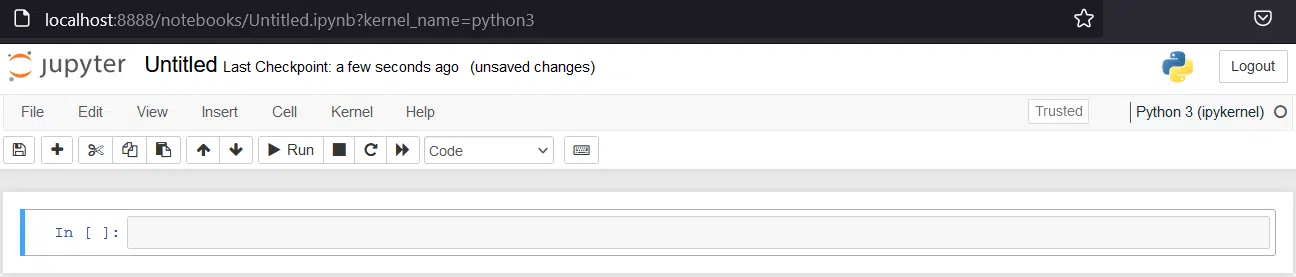
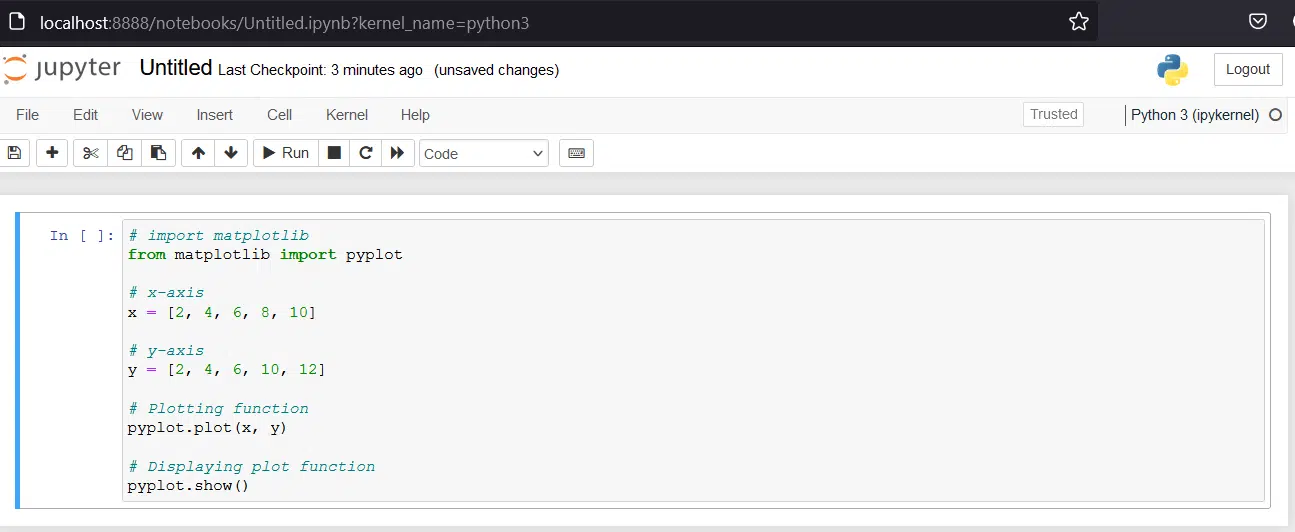
- In the text box, the code for our graph should be entered. For this example, our code looks like this:
# import matplotlib

from matplotlib import pyplot


# x-axis

x = [2, 4, 6, 8, 10]


# y-axis

y = [2, 4, 6, 10, 12]


# Plotting function

pyplot.plot(x, y)


# Displaying plot function

pyplot.show()
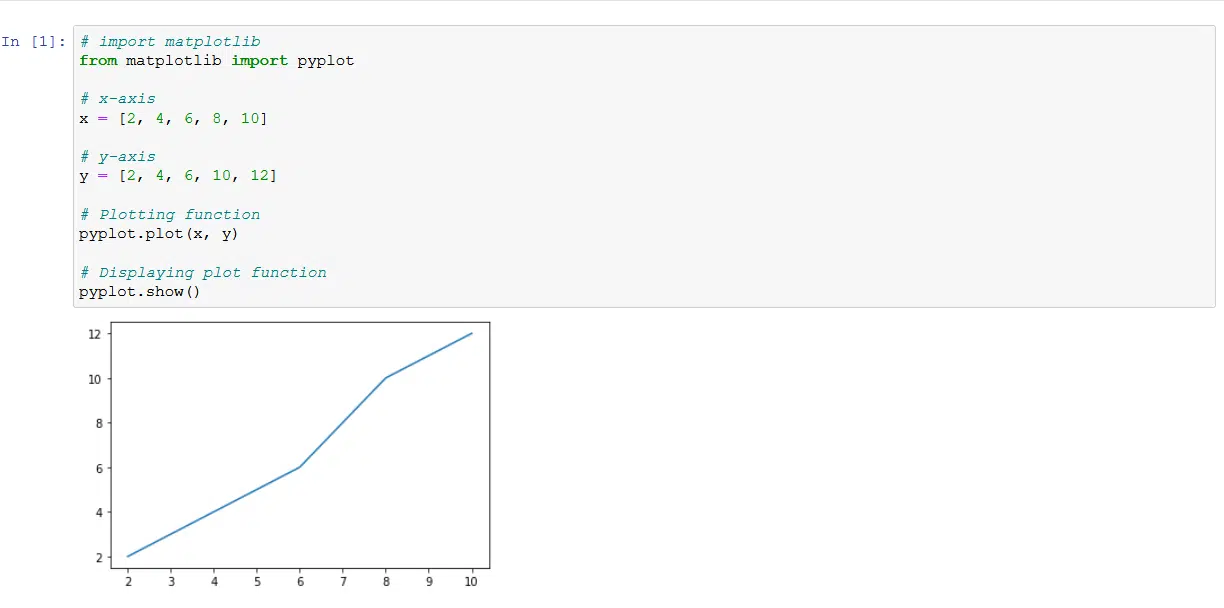
- Once the code has been entered, click Run and the plot should be displayed.
To learn more about using Matplotlib and its various functions available, we recommend checking out their official documentation and website here.
Conclusion
Learning how to display a plot in Python can be a very beneficial skill to add to your skill set, especially for those interested in Data Science and Data Visualization.
There are many reasons why someone may want to display or show a plot in Python. These include wanting to display data that has been collected, simply learning out of curiosity, and much more.
That being said, in this article, we looked at how to install Matplotlib on Windows, macOS, and Linux machines and verify that it works. Additionally, we looked at how you can show a plot using Python and Jupyter Notebook.
With that said, we hope you’ve found this guide helpful when it comes to installing Matplotlib and displaying plots in Python.
Feel free to share this post with your fellow coders to guide them through installing Matplotlib and plotting graphs in Python!

![FileNotFoundError [Errno 2] No Such File or Directory](https://guidingcode.com/wp-content/uploads/2022/12/FileNotFoundError-Errno-2-No-Such-File-or-Directory-8-260x195.png.webp)